Plotting with Matplotlib#
PyAnsys Units provides a simple interface to plot quantities using Matplotlib.
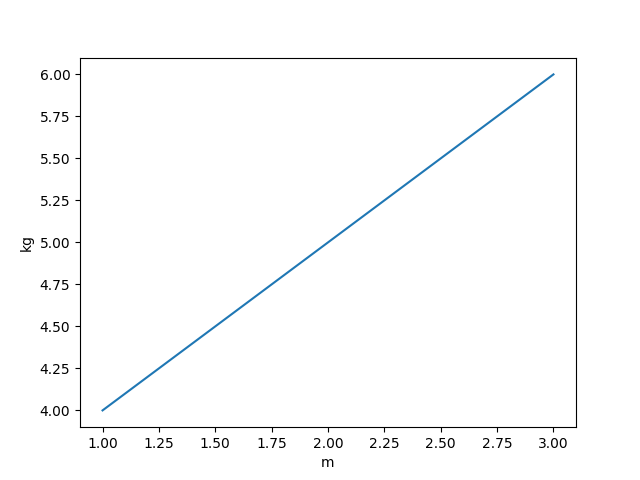
Basic usage#
The following example demonstrates how to plot data using lists.
import matplotlib.pyplot as plt
from ansys.units import Quantity

x_quantity = Quantity([1, 2, 3], "m")
y_quantity = Quantity([4, 5, 6], "kg")
fig, ax = plt.subplots()
ax.plot(x_quantity, y_quantity)
plt.show()
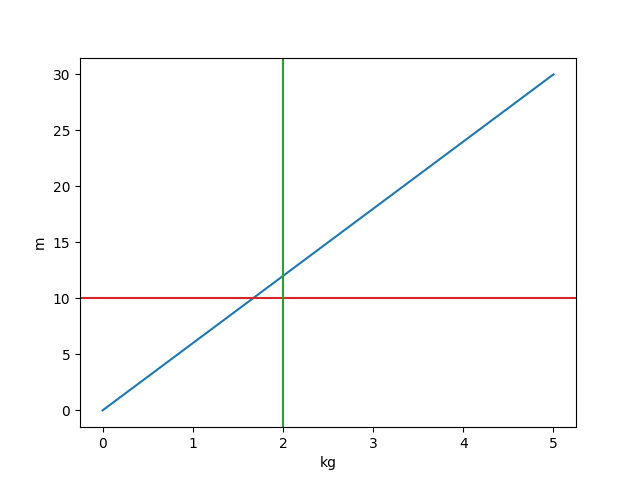
Using NumPy arrays#
The following example demonstrates how to plot data using NumPy arrays.
import matplotlib.pyplot as plt
import numpy as np
from ansys.units import Quantity, UnitRegistry

ureg = UnitRegistry()

y = Quantity(value=np.linspace(0, 30), units=ureg.m)
x = Quantity(value=np.linspace(0, 5), units=ureg.kg)
fig, ax = plt.subplots()
ax.plot(x, y)
ax.axhline(Quantity(10, ureg.m).value, color="tab:red")
ax.axvline(Quantity(2, ureg.kg).value, color="tab:green")
plt.show()
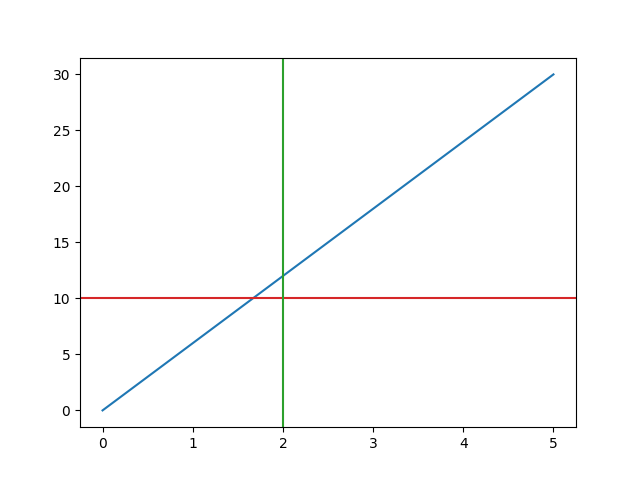
Using NumPy arrays and no units#
The following example demonstrates how to plot data without units.
import matplotlib.pyplot as plt
import numpy as np
from ansys.units import Quantity, UnitRegistry

ureg = UnitRegistry()

y = Quantity(value=np.linspace(0, 30))
x = Quantity(value=np.linspace(0, 5))
fig, ax = plt.subplots()
ax.plot(x, y)
ax.axhline(Quantity(10, ureg.m).value, color="tab:red")
ax.axvline(Quantity(2, ureg.kg).value, color="tab:green")
plt.show()